Posted 2021/4/9
Analyzing San Francisco 311 Cases For Fun (No Profit)
The city of San Francisco shares information about its 311 (non-emergency) cases with the public: cases since 2008 are available at https://data.sfgov.org/City-Infrastructure/311-Cases/vw6y-z8j6. As an experiment, I downloaded the whole body of data (all 2GB of it) and ingested it into Gravwell to play with. This post explains how I got it into Gravwell and what I did with it.
Get the Data
To get the raw data, go to https://data.sfgov.org/City-Infrastructure/311-Cases/vw6y-z8j6 and click the “Export” button, then select “CSV”. This download will take a long time. You should end up a file named 311_Cases.csv.
Ingest the Data
Unfortunately, we can’t just drop the file into Gravwell’s GUI data ingest tool. The CSV file contains newlines in the middle of entries, and the timestamps are not in a format Gravwell recognizes. Luckily, we can use the regexFile ingester to process them appropriate.
To build the ingester, grab Gravwell’s open-source repo, check out the dev branch (it has some tweaks to the ingester), and go build:
git clone https://github.com/gravwell/gravwell.git
cd gravwell/ingesters/regexFile
git checkout origin/dev
go build
Then we can use the newly-built ingester to parse and upload the data:
./regexFile -tag-name sf311 -rexp '\d+,\d{2}\/\d{2}\/\d{4}\s' \
-cust-ts-regex '\d{2}\/\d{2}\/\d{4}\s\d{2}:\d{2}:\d{2} [A|P]M' \
-cust-ts-format '01/02/2006 03:04:05 PM' \
-clear-conns CHANGEME.example.org:4023 -ingest-secret SET_ME \
-i /PATH/TO/311_Cases.csv
These options are complex, so they deserve a bit of explanation. First, we’ll cover the parameters which you’d need to modify before running the command yourself:
-clear-conns CHANGEME.example.org:4023 -ingest-secret SET_MEspecifies how to connect to the Gravwell indexer. It says that the indexerCHANGEME.example.orgis listening for unencrypted connections on port 4023 and expects the shared secret “SET_ME” for authentication.-i /PATH/TO/311_Cases.csvtells the ingester where the CSV file can be found.
The following parameters shouldn’t need to be changed:
-tag-name sf311says that this data will go into the “sf311” tag.-rexp '\d+,\d{2}\/\d{2}\/\d{4}\s'specifies a regular expression to denote the start of an entry–this is needed because entries in the CSV can contain newlines. Each entry in the CSV file begins with a numeric case ID, followed by a comma, followed by a date and a space; this regex matches that and is sufficient to split the entries correctly.-cust-ts-regex '\d{2}\/\d{2}\/\d{4}\s\d{2}:\d{2}:\d{2} [A|P]M' -cust-ts-format '01/02/2006 03:04:05 PM'specifies a custom timestamp format so the ingester can parse out the appropriate time from each entry.
Note that the ingester will take a while to run; here’s the stats from when I ingested the data:
Completed in 9m59.054226372s (1.91 GB)
Total Count: 4.75 M
Entry Rate: 7.94 KE/s
Ingest Rate: 3.26 MB/s
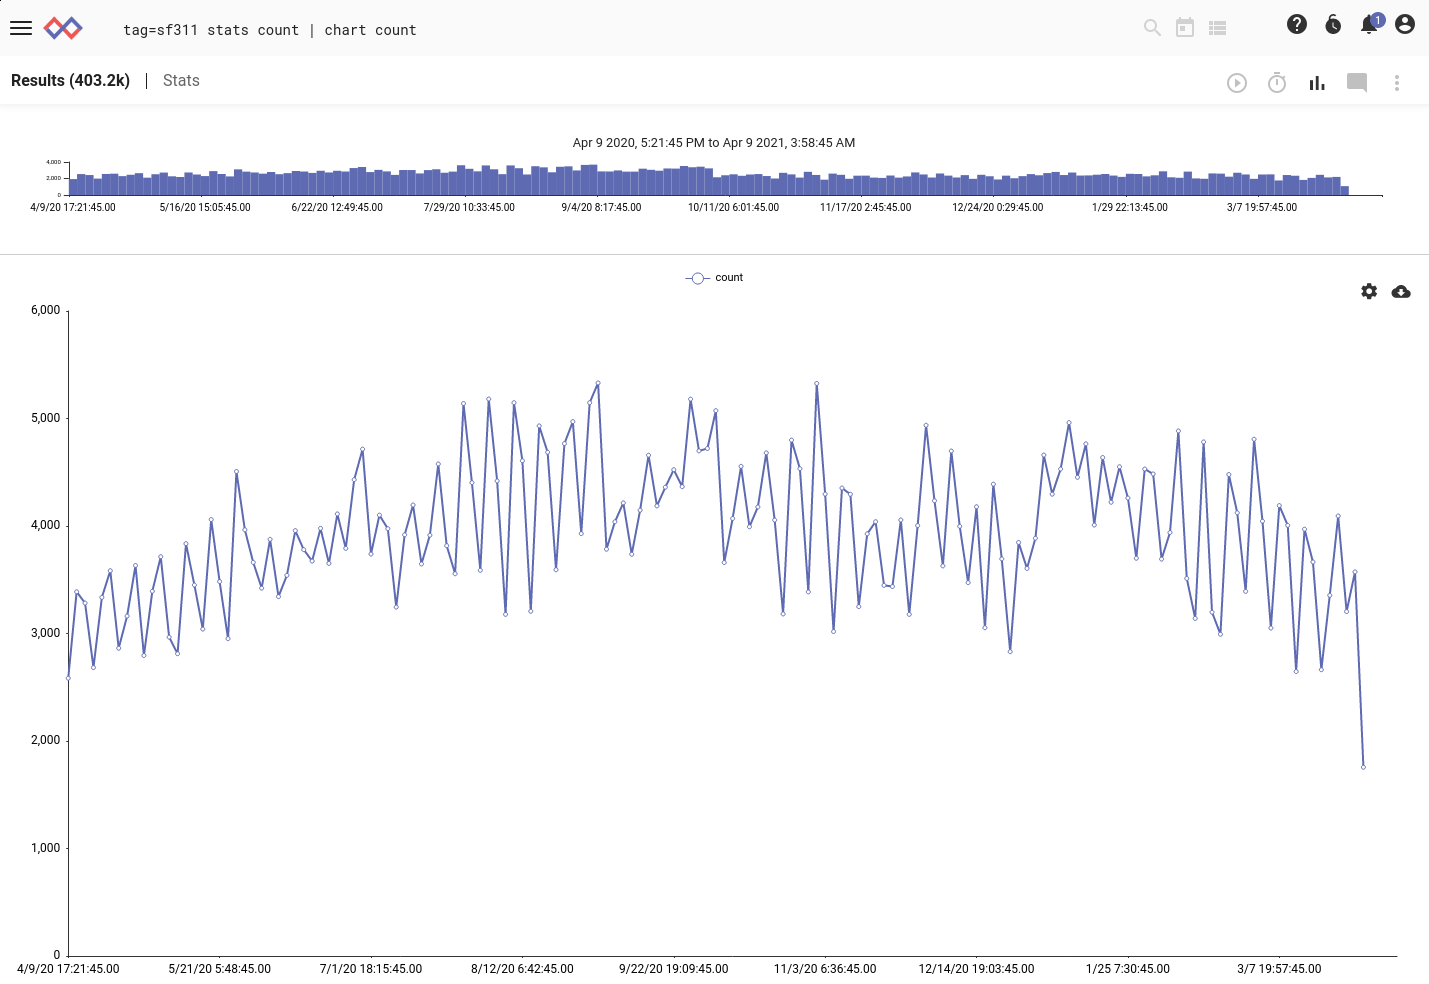
Regular expressions are expensive, and with almost 5 million entries to parse it takes a while. We can verify that the entries are arriving with a simple query:
tag=sf311 stats count | chart count
Installing an Autoextractor Definition
It will be a lot easier to work with the data if we have an autoextractor defined for it. Go to the “Extractors” page in the Gravwell GUI, click the “Add” button, and fill it out to look like this:
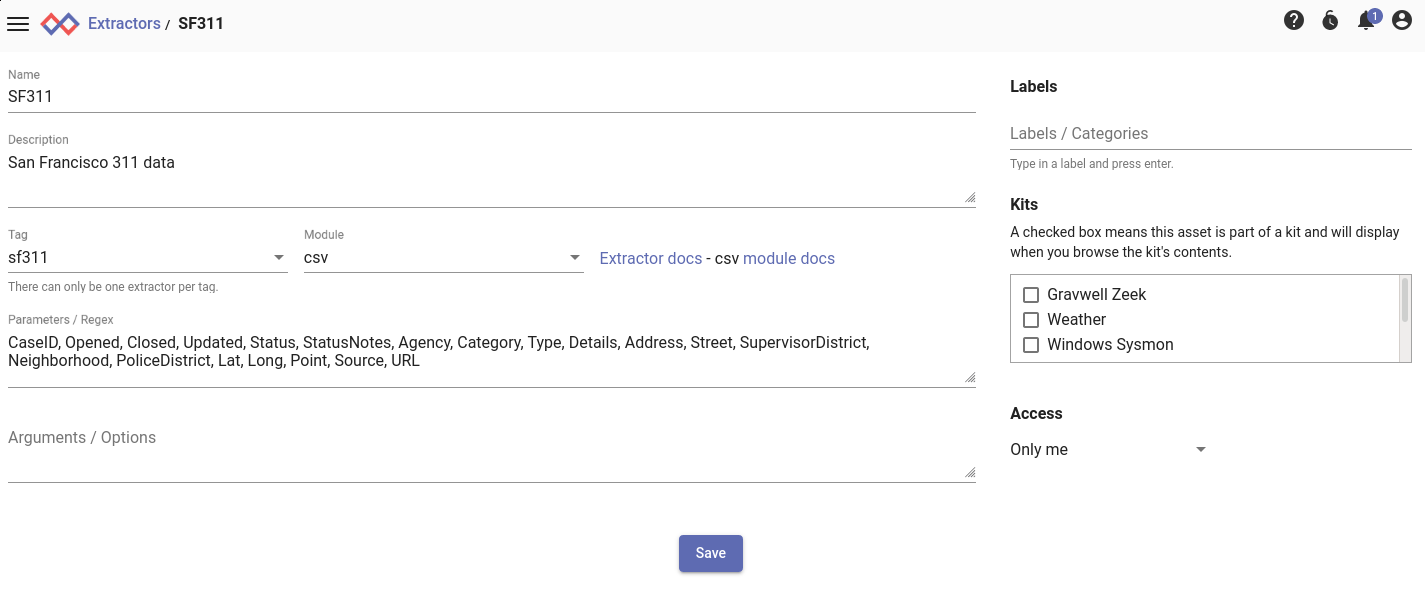
For convenience, here’s what goes in the Parameters field:
CaseID, Opened, Closed, Updated, Status, StatusNotes, Agency, Category, Type, Details, Address, Street, SupervisorDistrict, Neighborhood, PoliceDistrict, Lat, Long, Point, Source, URL
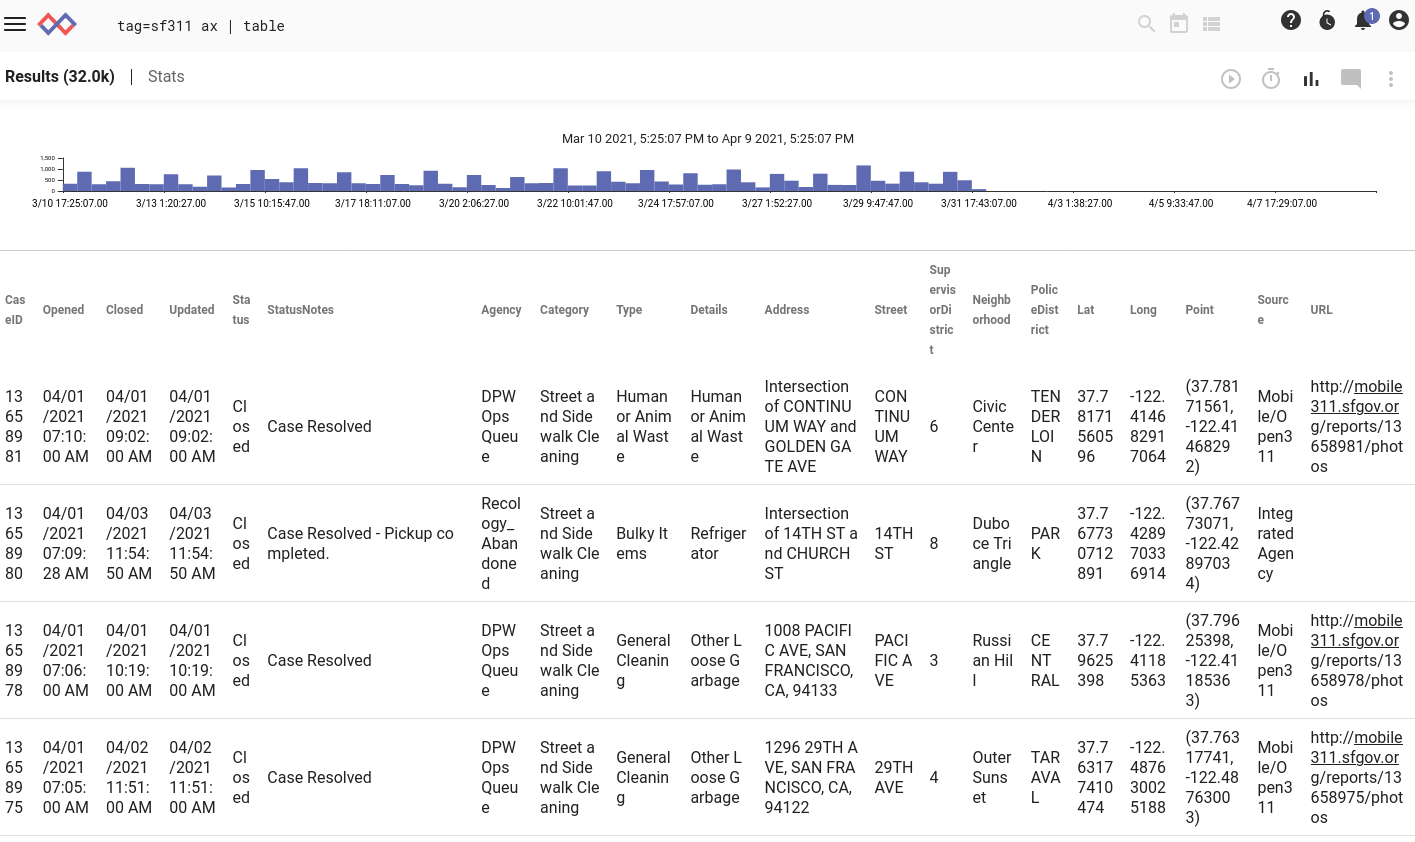
With this installed, we can run tag=sf311 ax | table and see the individual fields broken out nicely:
Analyzing the Data
At last! Let’s start poking around with the dataset. First off, let’s do what everyone’s been thinking: the poop map.
The Poop Map
We’ll use the heatmap renderer to see where the most reports of human or animal waste have occurred:
tag=sf311 ax Type=="Human or Animal Waste" Lat Long
| eval setEnum("lat", toFloat(Lat)) | eval setEnum("long", toFloat(Long))
| heatmap -lat lat -long long
Here’s the resulting map for the month of March:
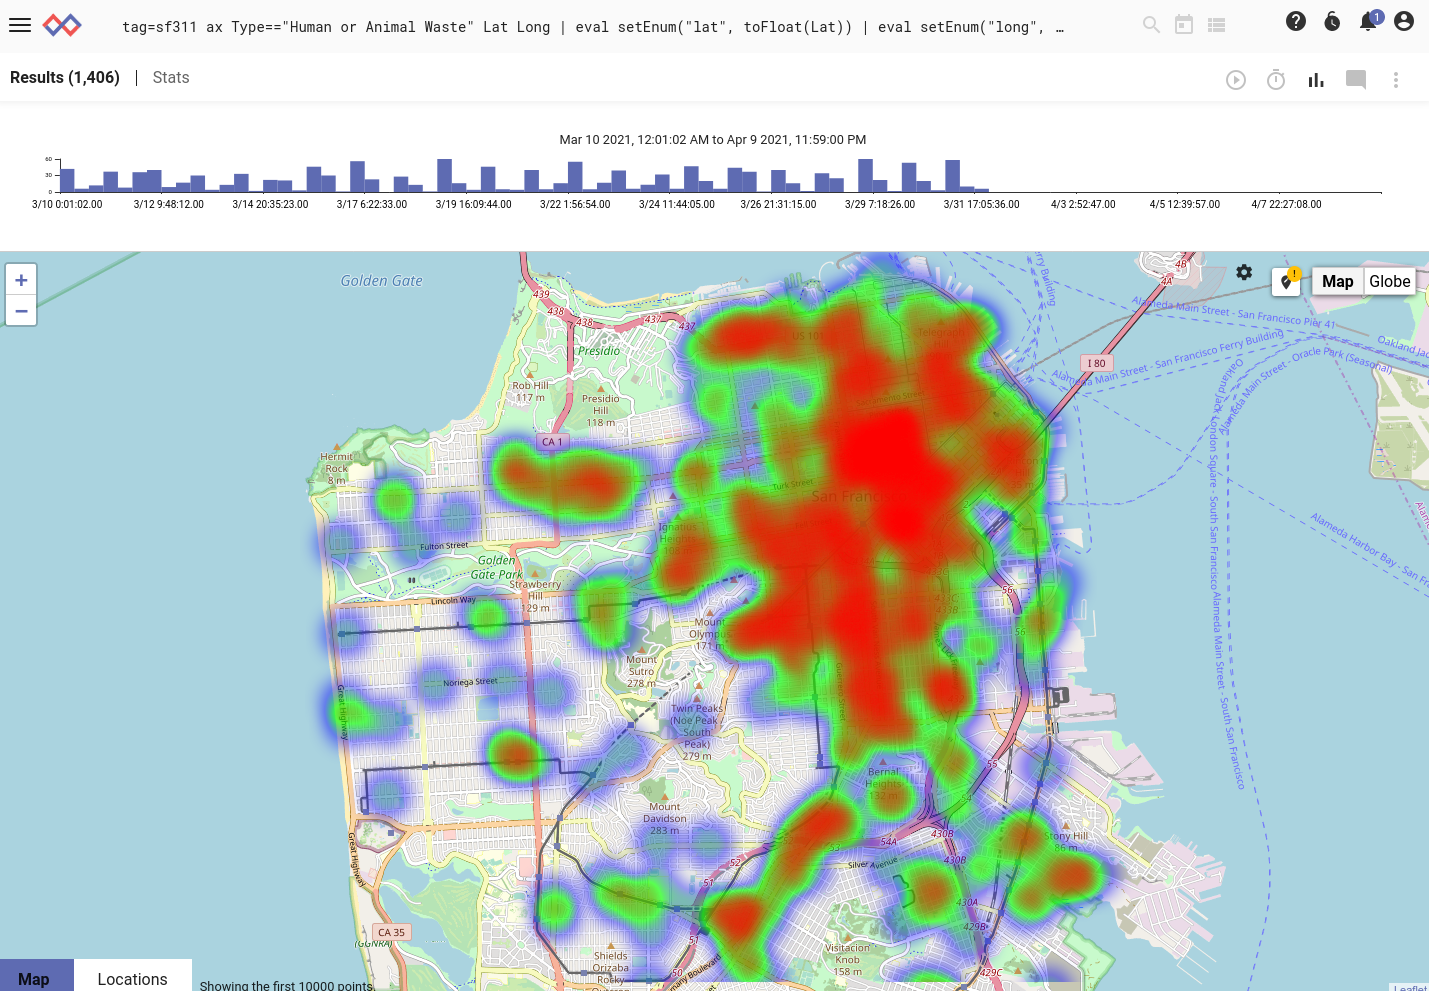
That’s unpleasant. Looks like you should head for the Sunset or Richmond districts if you want to keep your shoes clean.
Many case reports include a URL field (see a screenshot with a highlighted example here). This typically points to an image of whatever's being reported. I strongly recommend against opening these URLs in the case of "Human or Animal Waste" reports.
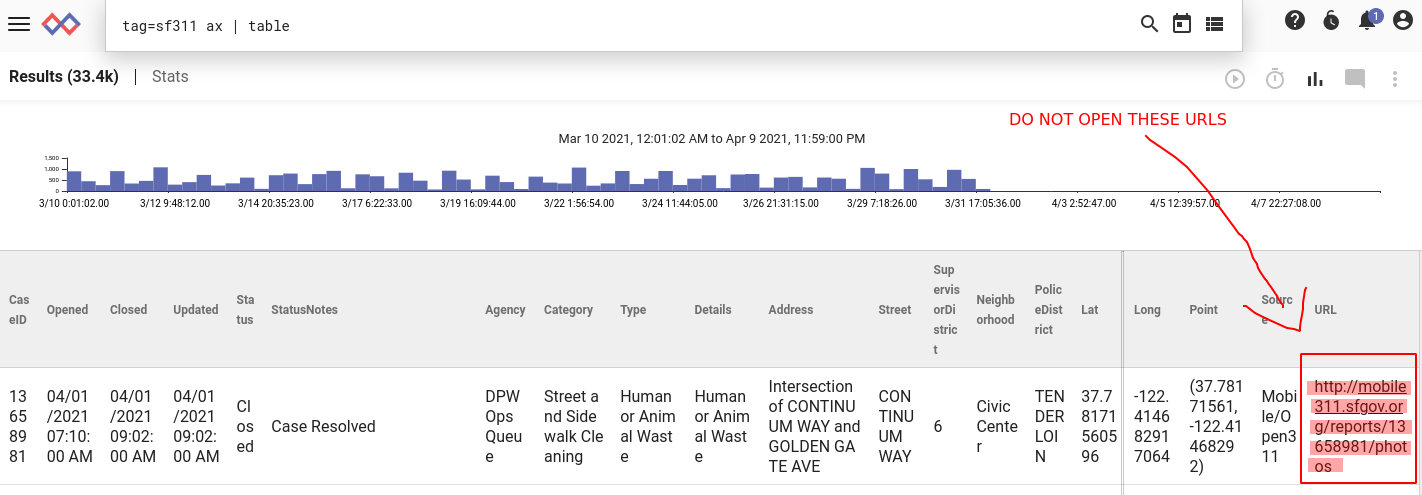
Is There That Much Poop, Really?
The heatmap above looks pretty scary, but let’s see how many of the requests are actually about poop. First, we can look at the top-level categories over a year:
tag=sf311 ax | stats count by Category | chart count by Category
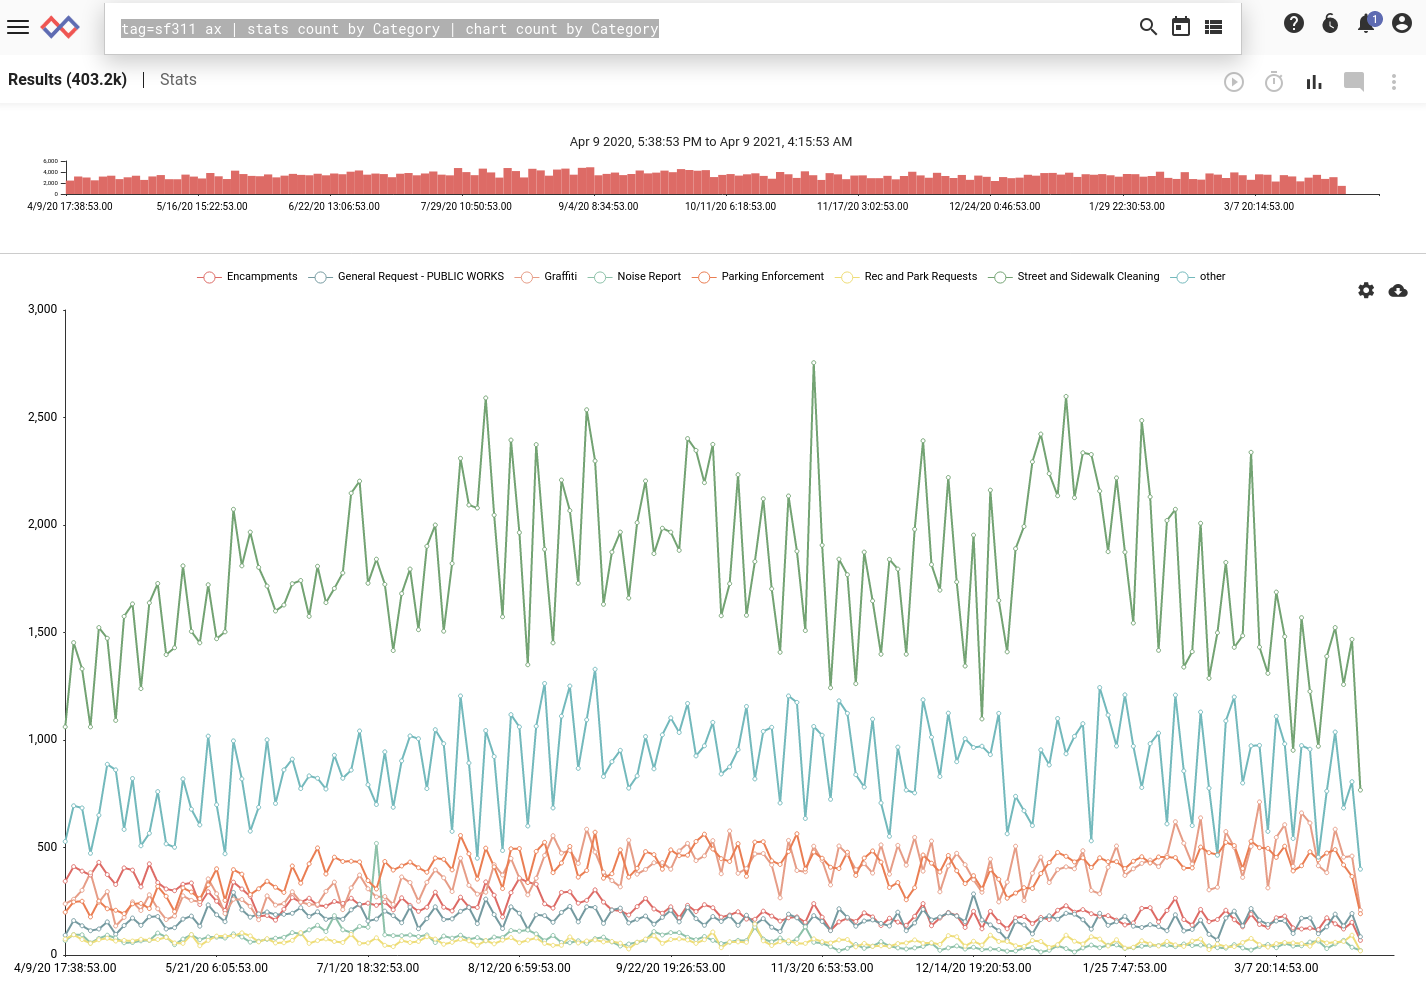
Based on the chart, we can see that the #1 category of 311 calls is “Street and Sidewalk Cleaning”. Let’s drill down into the category and look at the different call types within it:
tag=sf311 ax Category=="Street and Sidewalk Cleaning" Type
| stats count by Type | chart count by Type
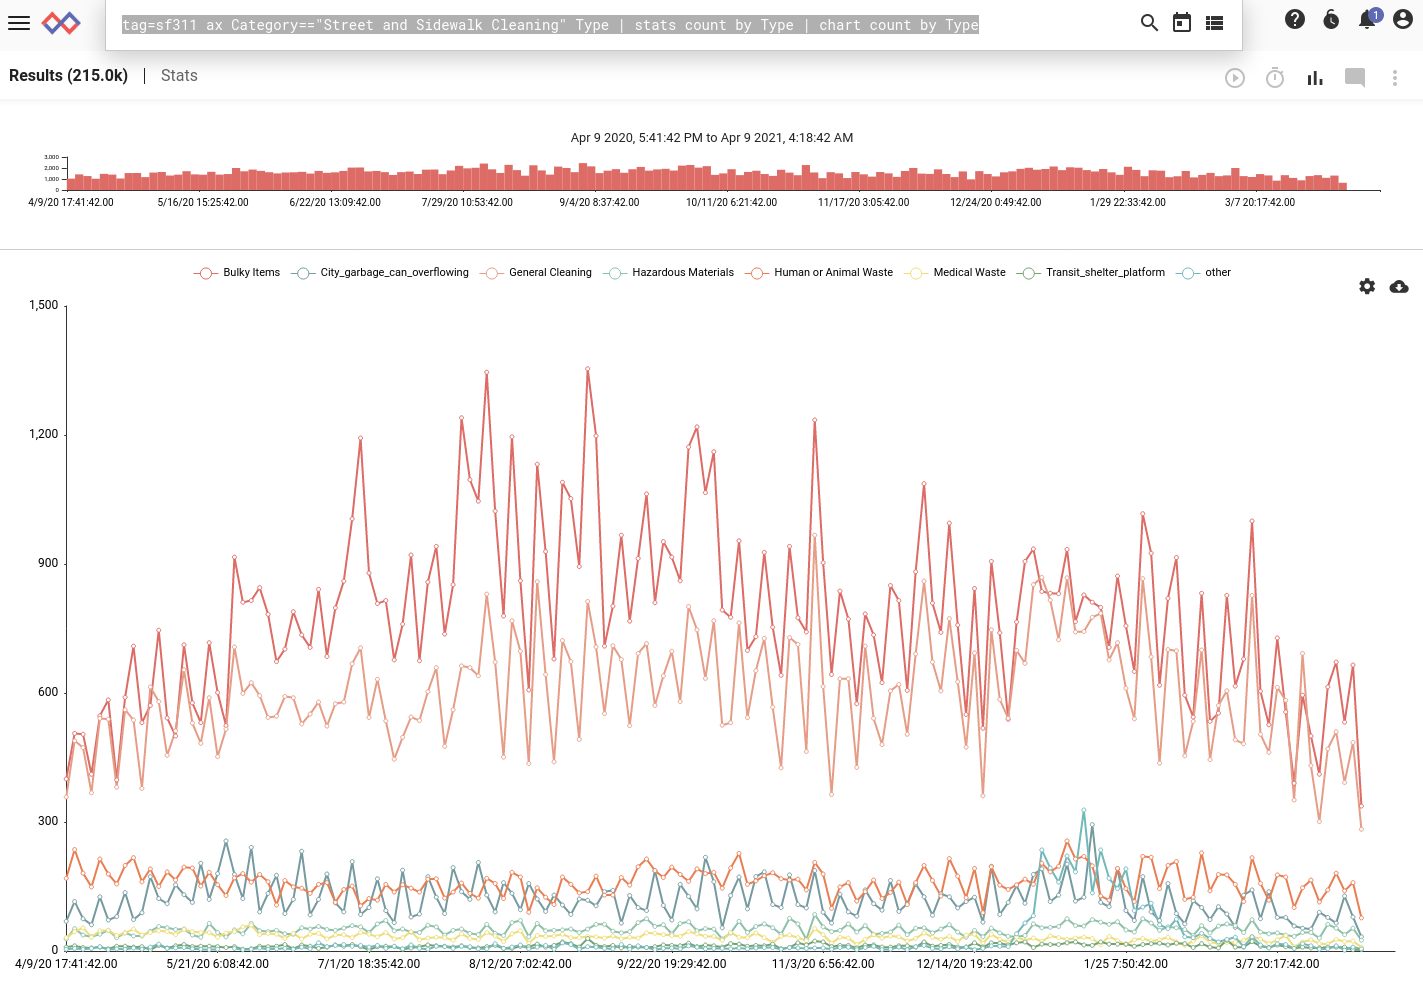
The top two lines are “Bulky Items” and “General Cleaning”, but tying for third are “City garbage can overflowing” and our old friend, “Human or Animal Waste”!
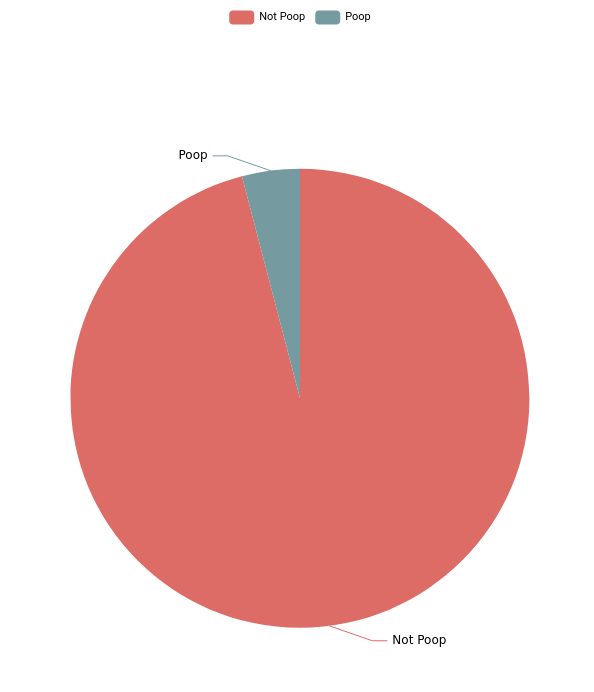
We can see that street cleaning is the #1 category of calls, and that within street cleaning, poop pickup is a pretty good proportion, but we can put together one more query that will group calls into two groups: Poop, and Not-Poop. To do this, we’ll use the eval module:
tag=sf311 ax Type
| eval if (Type == "Human or Animal Waste") { setEnum("group", "Poop") } else { setEnum("group", "Not Poop") }
| stats count by group | chart count by group
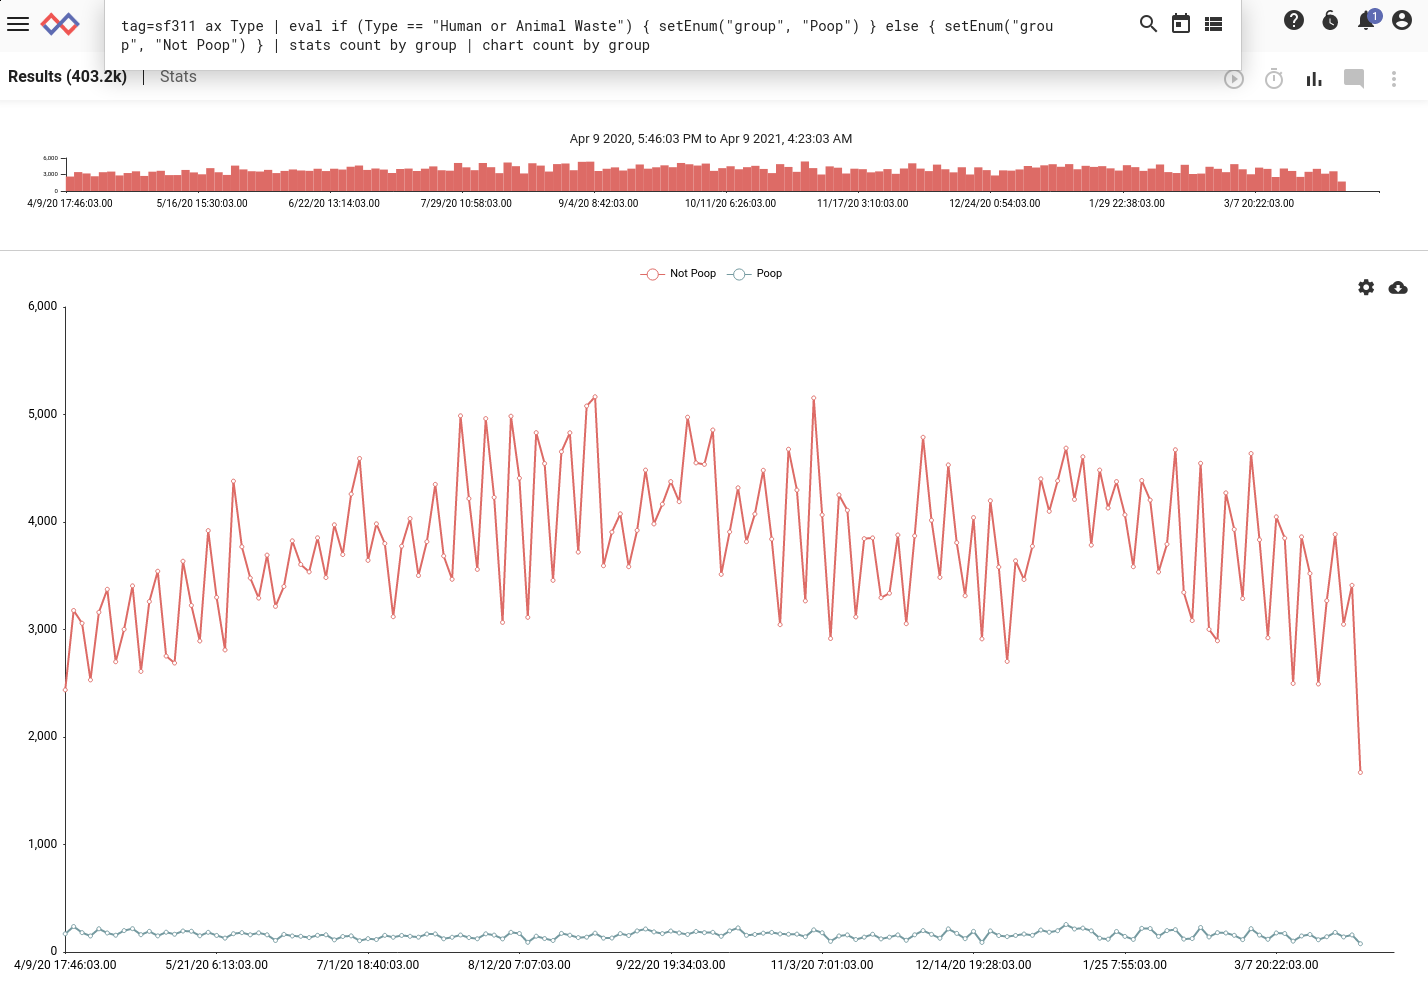
Well, it looks like the City of San Francisco doesn’t spend ALL its time responding to calls about poop on the sidewalks. I’ll close with the same query re-displayed in every manager’s favorite style: the pie chart.
Conclusion
This is just a goofy personal blog post so I won’t go full call-to-action, but if you think this is cool, Gravwell (the company I work for!) has a free Community Edition tier so you can try it yourself. The best part is that the 1.9GB of 311 call data just fits into the 2GB daily (daily!) ingest quota for Community Edition! But if you go over, just send us an email saying you ran out of space while trying to analyze poop, and we can expand the quota for you.